
ℹ️NOTE: Kaskada is now an open source project! Read the announcement blog.
As a data engineer, it is helpful to have a high-level understanding of machine learning to know how best to support data scientists in creating great models. This article explains some of the terms and how the high-level process works. My experience is as a Software engineer and a data engineer, so I’ll try to explain how I understand things, which may resonate with your experiences. This understanding developed over several years of working closely with some amazing data scientists, who have also helped review this for the correct usage of terms and concepts. You probably won’t be able to create a model after reading this, but you will better understand how you can help data scientists create a model.
What is a Model?
Let’s start with a straightforward model you’re probably familiar with–linear regression. Given many data points, we can plot them and attempt to fit a line to them.
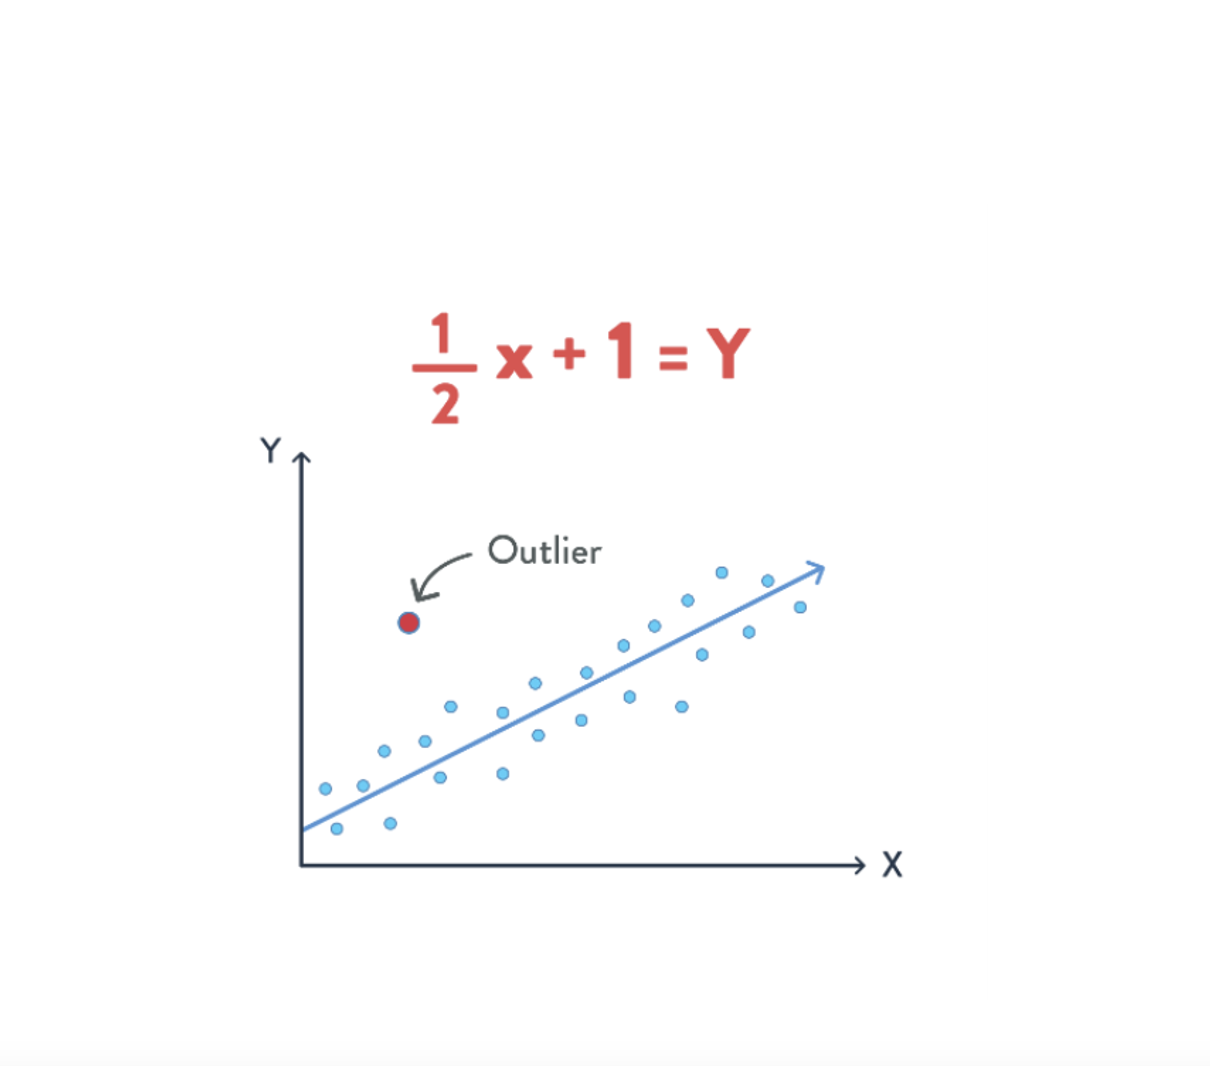
We see many data points and a line that we may have fit to that data on the right. You may already be familiar with the term “outlier” meaning a point that doesn’t fit the rest of the data. Real data is often messy, and outliers aren’t unexpected.
When training a model, each of these points is referred to as a “training example.” Each training example has an x and y value and represents an example of what we’re training a model to predict. Once we have a model, we can ask, “if a new point has x=3.7, what would we predict the value of y is”? Based on the line we fit, we would predict y=3.7/2+1=2.85.
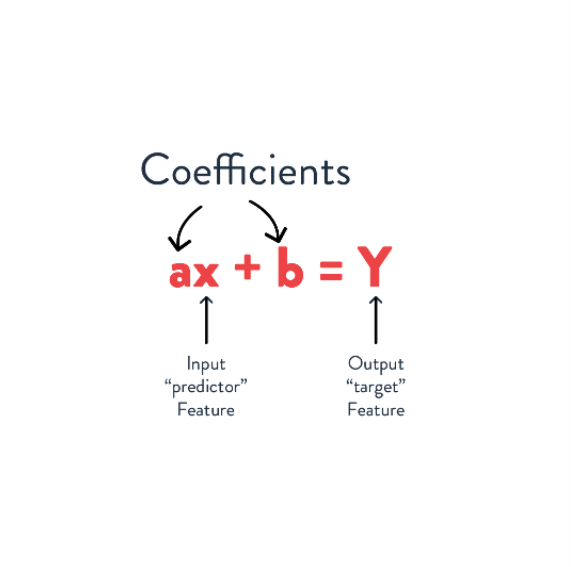
In this model, we may say that x is a predictor feature – a value used to make the prediction – and y is the target feature – the value we are predicting. Most models use more than a single predictor, but before we get there, let’s look at another set of data with just two dimensions.
Do you think linear regression will produce a good model given the training examples here?
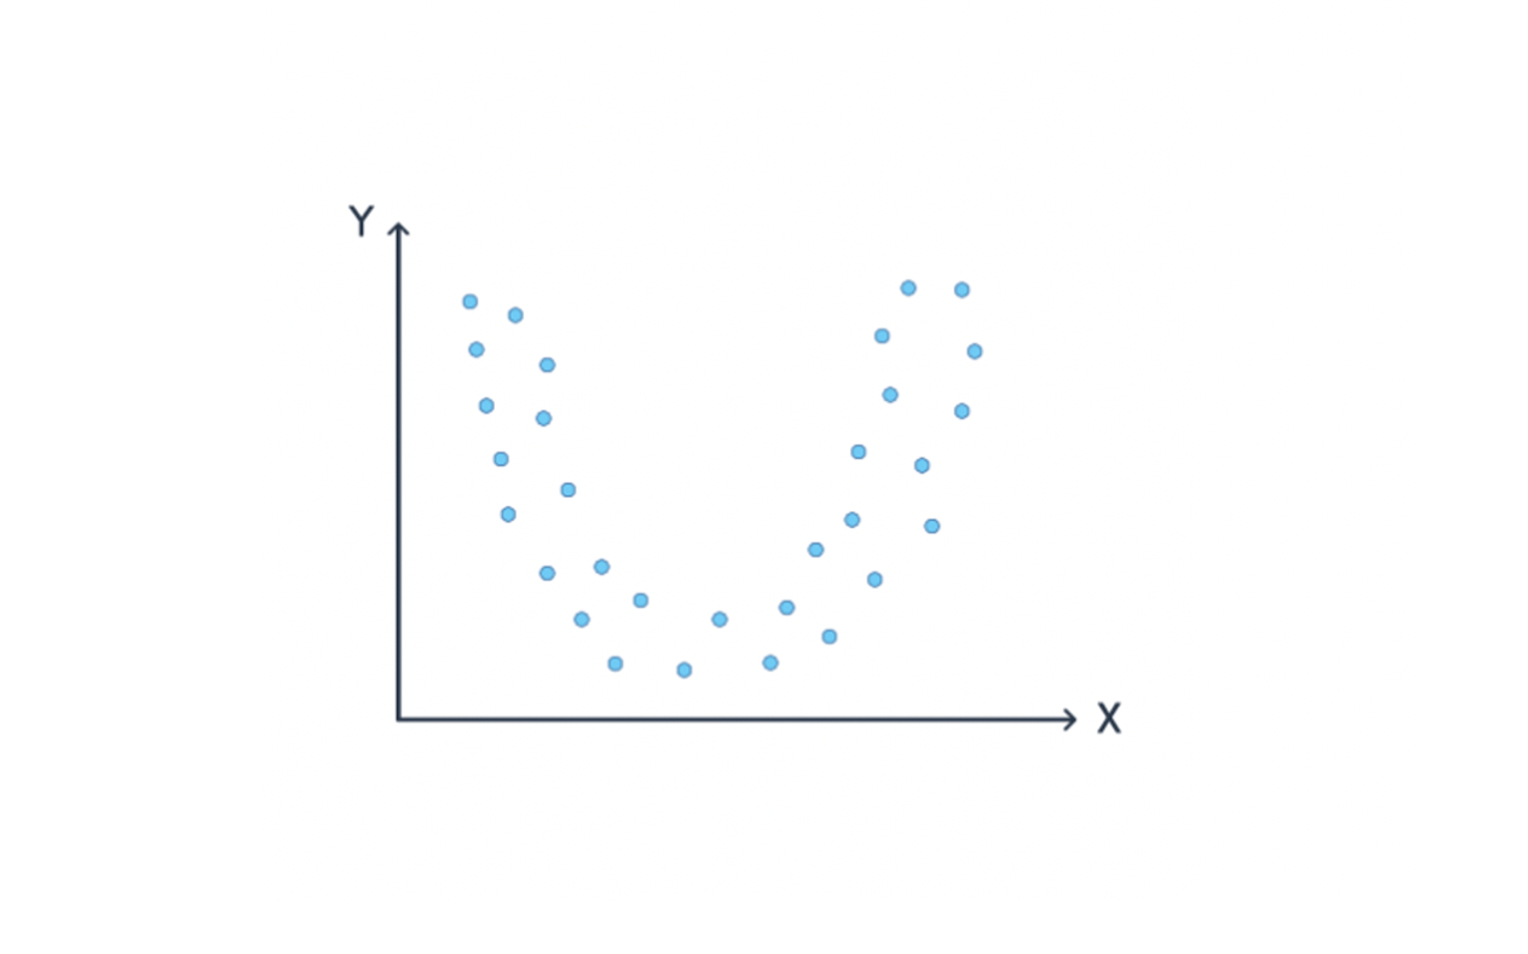
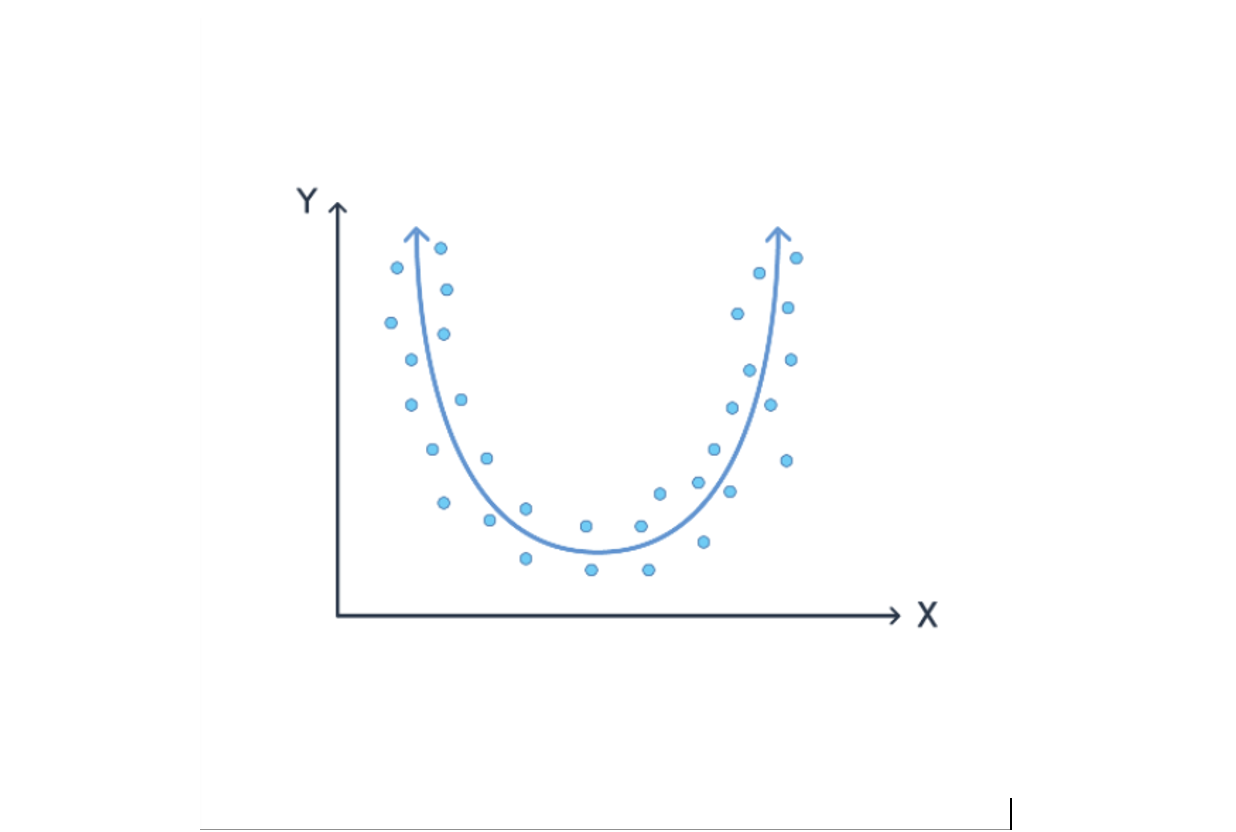
Of course not! The points don’t make a line. Instead, we’d need to fit a curve to the data. For instance: ax2+bx +c=y.
We’re almost done, but so far we’ve only talked about predicting one value from another. How could we use this to predict future user behavior? It all depends on how we compute the values. If the predictor (x) was computed in January and the target (y) was computed in February, then we have trained a model which predicts behavior one month after the values it applied to. This is why working with time and historical data is important for creating training examples that lead to predictive models.
Even with these simple models, we have seen a few important aspects of machine learning:
-
Different problems may be solved better by different kinds of models.
-
By looking at (visualizing) the data, we can gain useful insights.
-
The quality of the model depends on the quality of the training data.
-
We can create models that predict the future by creating training examples with time between predictors and targets.
Models often differ from these simple examples by having more than a single predictor feature. Imagine the function being fit takes more than a single x value. Instead, it takes a vector containing many different predictor features. This is where the term feature vector comes from – it’s simply a vector of feature values. For instance, training a model to predict future activity may use the number of movies watched in several different categories as the features.
Another way that models often differ is by using a more sophisticated model and more sophisticated training techniques. These can efficiently discover more complex relationships between many predictor features and the target value.
So while two dimensions may make it seem straightforward, most models use many predictors–tens to hundreds. Humans cannot easily visualize the relationship between more than three dimensions, so it is difficult to understand these more sophisticated models. While there may be many possible features to consider, finding the right set is difficult. And it isn’t as easy as providing all of them to the model – that often significantly increases the time it takes to train the model since it needs to make sense of the noise.
What is the ML Process?
What surprised me about the ML process is how much iteration is involved. When adding functionality to a software project, I start with an idea of what I want to add. I may have requirements or mocks. Depending on the scope, I may begin by writing tests right away or designing the different parts I need to build. But the data science process involves more experimentation – it is more like debugging than writing code!
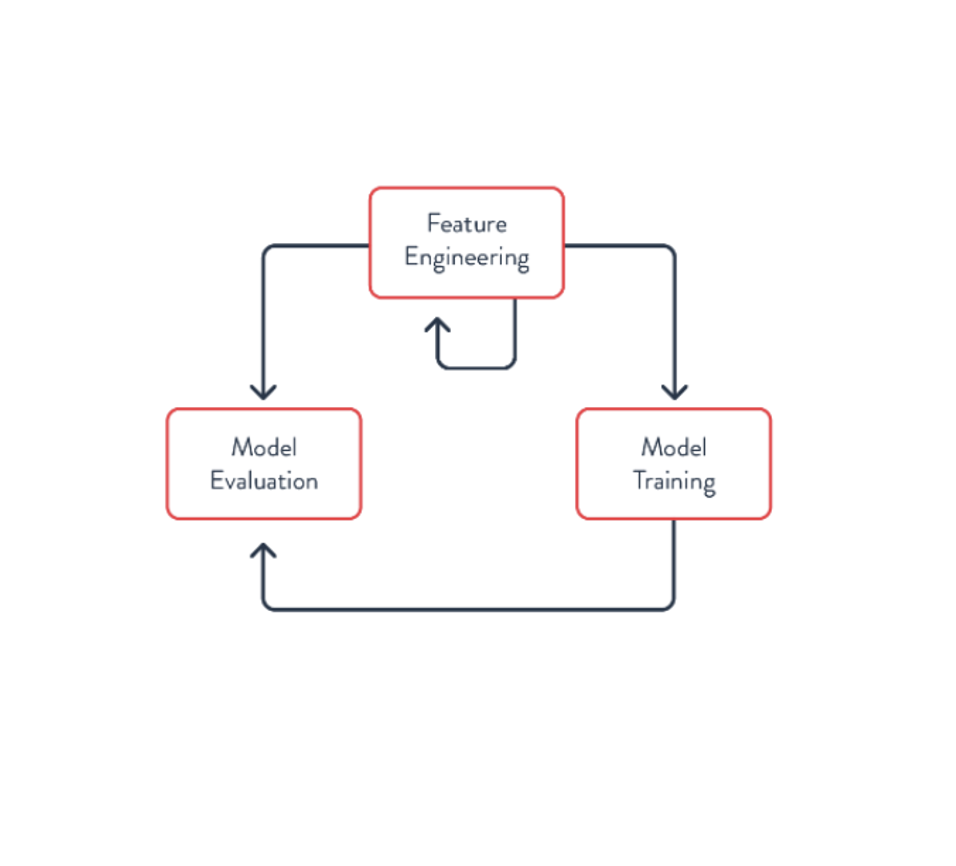
The data scientist may hypothesize that some feature or information about the user will improve the quality of the model—the accuracy of predictions. For example, maybe they think knowing how many hours someone has been awake will help predict whether they’ll order coffee or water. So, they run an experiment to test that hypothesis. This experiment involves figuring out how to get that data and compute training examples, including the new feature, training a new model with the additional feature, and seeing if the results are better than the previous model.
Of course, there are established techniques for ensuring quality results from the experiment—separating the data used for training and validation, etc. These are important for doing the process correctly and avoiding problems such as overfitting. The Data Scientist performs these as part of creating and evaluating the model, so we won’t explore these deeply now. The main takeaway is that the feature engineering process may be repeated many times to produce a good model. It may involve trying hundreds of different features.
This is the first loop of the ML process. It should be a fast process, allowing the Data Scientist to quickly test many different hypotheses to identify the most useful features for creating the model.
At each step of the process, the data and features may be visualized to get a sense of how things are distributed. But creating the model isn’t the only iterative process. Often, the process looks more like this – one loop involves creating the features and corresponding model, as we just saw.
At times, Feature Engineering requires wrangling and analyzing new sources of data. This may be data that is already available at your organization but which the Data Scientist hasn’t used before, or it may involve acquiring or collecting additional data.
Finally, once the model is created, it needs to be deployed to production and the actual results evaluated. This may involve measuring the error between actual and predicted values or looking at the impact of the model on user behaviors.
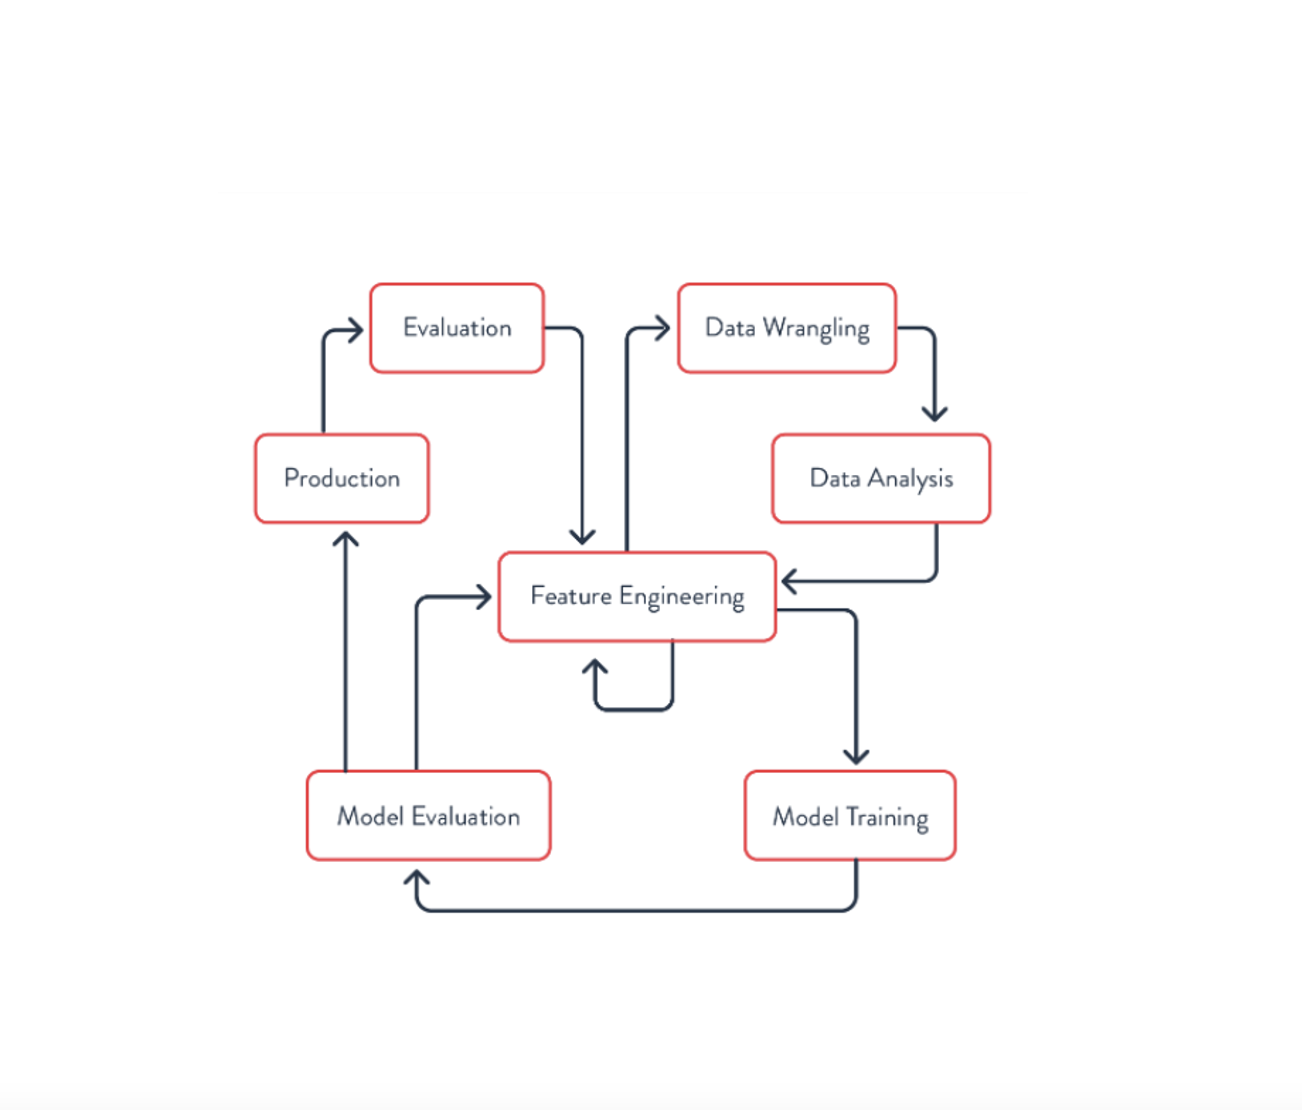
After it has been deployed, a model may need to be further refined. Even if it initially had good results, the data (and user behavior) may drift over time, requiring retraining or even creating new features for the model to adapt to the changes.
Feature Engineering
Creating features involves working with the data to compute the feature values for each training example. Each training example is created from a specific entity for which predictions may be made. In many cases, the entity may be specific users, but in other applications of ML it could be a specific vendor, ATM, etc. Generally, the entity is the noun the predictions are being made for. To ensure the examples are representative, they are often computed for many different entities.
As noted, Feature Engineering is an iterative, experimental process. It may use familiar techniques such as filtering & aggregation to define the features, but it also has special techniques. For instance, there are a variety of ways of encoding categorical data – what I would consider an enum. It often may be undesirable to assign each category a number since that may confuse the model – it is likely insignificant that Delaware is the 1st state and Hawaii the 50th state.
Another concern during this process is leakage. Leakage happens when the information related to the target (the y values in the simple linear regression example) is used as one of the predictors. In this case, the model may seem good in training and validation where this data is available but perform poorly in production when it is not. One form of leakage that is easy to introduce accidentally is temporal leakage. If you’re using information from one point in time to predict the value at some later point in time, then your predictor feature should not include anything that happened after the first point in time.
Conclusion
Much more could be said on these topics, but I wanted to keep this brief. Hopefully, this provides some insight into the ML terms and high-level process used by Data Scientists. As data engineers, we must recognize the Feature Engineering process is iterative. Anything we can do to make it easier for data scientists to iterate quickly has significant benefits. Further, it is useful to understand how data scientists need to work with temporal and historical data to create training examples. These are two things to keep in mind as you create and deploy new data processing tools for Data Scientists at your organization.
Stay tuned for more information on how we can help data scientists create better models and deliver business value faster!